
무인 엔진 관측과 정지
AI 작업 엔진을 사람 없이 몇 시간씩 돌리기 위한 두 장치 정리. AI 호출 없는 대시보드의 로컬 → 클라우드 이전 이유, 켜 둔 화면과 작업률의 오표시 결함, 사용량 한도 도달 시 호출 도중 정지 장치와 Windows 프로세스 트리 함정까지.
앞 글의 주제는 작업 엔진의 설계. 이 글의 주제는 그 엔진을 실제 무인으로 돌리며 추가한 두 장치. 사람이 자리에 없을 때 지금 무엇을 하는지 보는 장치, 그리고 멈춰야 할 때 확실히 멈추는 장치.
두 장치 모두 실전 검증 완료. 엔진이 다른 프로젝트의 작업 15건을 연달아 처리하는 동안 이 화면으로 관측했고, 사용량 한도에 걸려 정지 후 재개하는 상황도 실제로 여러 번 발생.
AI 호출 없는 대시보드
엔진은 원래부터 기록이 풍부한 구조. 호출마다 어떤 역할이 어떤 모델로 불렸는지, 어떤 도구를 썼는지, 지금 어느 단계인지. 대시보드의 역할은 이 기록을 읽어 브라우저 한 화면에 표시하는 것뿐.
| 원칙 | 이유 |
|---|---|
| AI 호출 0 | 관측에 토큰을 쓰면 관측 비용이 작업을 잠식 |
| 읽기 전용 | 화면이 엔진 상태를 바꿀 경로 자체가 불필요 |
| 엔진은 기록 칸만 추가 | 대시보드 때문에 엔진 동작이 달라지는 상황은 금지 |
엔진 쪽 변경은 기록 칸 몇 개(이벤트, 심박, 현재 상태) 추가가 전부. 도구 사용이 엔진 기록에 남고 화면 서버에 도착하기까지 0.1~1.7초(8건 측정). 화면 갱신 주기는 2초.
제작 중 겪은 일 하나. 처음 잡은 대시보드 포트는 8765였는데, 그 번호를 엔진의 웹 QA 테스트 서버가 이미 사용 중. 대시보드를 켠 채 전체 테스트를 돌리자 테스트가 자기 페이지 대신 대시보드를 열고 실패. 포트를 8799로 이동했고, 이후로는 대시보드를 켠 상태에서도 테스트 통과를 확인하는 방식으로 운영.
랜섬웨어 방지 알림과 클라우드 이전
첫 형태는 PC에서 뜨는 전용 브라우저 창. 콘솔 창 없이 바로가기 하나로 열리도록 전용 프로필로 브라우저를 실행하는 방식. 그런데 이 창이 떠 있는 동안 1~3분마다 Windows 보안의 「제어된 폴더 액세스」 알림 발생. 랜섬웨어 방지 기능. 새 프로필로 뜬 브라우저가 이 기능에 막히는 상황이라는 점은 이벤트 로그로 확인.
보안 예외를 추가해 알림을 끄는 방법도 존재. 그 대신 어디서든 볼 수 있는 사이트로 옮기자는 결정에 따라 화면을 PC 밖으로 이전.
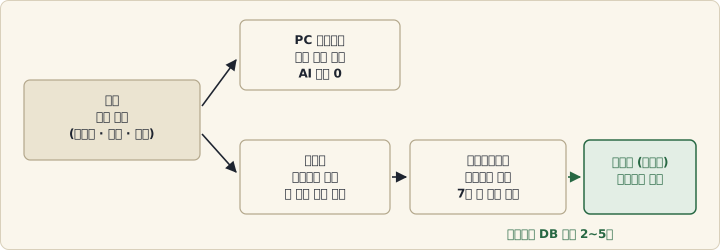
| 부분 | 역할 |
|---|---|
| 업로더 | 엔진 실행 명령과 함께 창 없이 자동 시작, 변경된 기록만 전송, 10분 유휴 시 종료 |
| 데이터베이스 | 비로그인 시 표·파일 모두 거부. 7일 지난 기록은 자동 삭제 |
| 사이트 | 로그인 사용자 전용. PC판과 같은 화면 코드, 폰 폭(390px)에서도 넘침 0 |
첫 동기화 결과는 최근 7일치 작업 14건, 파일 491개, 28.3MB에 96초. 이후로는 변경분만 전송, 변경이 없으면 0.2초에 종료. 연습 작업 기준으로 호출 시작은 2초, 도구 사용은 2~5초, 단계 이동은 3~5초 안에 클라우드 DB 도착. 계정 사용량도 호출 도중 갱신.
화면 오표시 결함 두 가지
사용 중에 화면이 틀린 내용을 보여 준 사례가 두 건.
켜 둔 화면의 옛 작업 표시. 대시보드는 처음 열 때만 표시할 작업을 선택하는 구조. 켜 둔 상태에서 새 작업이 시작되면 화면은 지난 작업에 계속 머무는 상태. 지금은 항상 현재 실행 중인 작업을 추적. 새 작업이 시작되면 약 6초 안에 화면 전환, 서로 다른 프로젝트 두 개가 동시에 돌면 전환 버튼 표시. 지난 작업 목록은 기본 접힘.
25분 동안 5%인 작업률. 작업률을 단계마다 고정값으로 표시한 탓에, 작업자가 첫 호출 하나로 25분 넘게 일하는 동안 화면은 내내 5%. 작업 중인지 정지 상태인지 구분 불가. 단계 안의 진행분을 채우는 방식으로 변경.
| 단계 | 진행분 계산 |
|---|---|
| 작업 | 이번 작업 대상 파일 중 작업 시작 뒤 수정된 비율 |
| 시나리오 실행 | 끝난 시나리오 비율 |
| 평가 호출 | 경과 시간 ÷ 평소 소요 시간 (「추정」 표시) |
진행분은 다음 단계 값 직전까지만 상승, 정지가 의심되면 진행분 없이 단계 값만 표시. 엔진이 시작할 때 대시보드 코드를 불러오는 구조라, 실행 중인 엔진의 파손을 막으려고 사본에서 제작 후 파일마다 원자적 교체. 실제 작업 43건의 기록으로 계산해 오류 0건 확인.
정지: 사용량 한도 도달 시 호출 도중 차단
관측 장치보다 중요한 건 정지 장치. 엔진은 구독 계정의 사용량을 읽어 기준 초과 시 정지하는 구조. 기준은 5시간 창 95%, 주간 창 97%.
그런데 실전에서 주간 사용량 98%인데도 정지 실패. 원인 확인 결과, 엔진은 호출 도중 사용량을 읽기는 했지만 기준 초과 시 「다음 호출 전 정지」 표시만 남기고 지금 호출은 끝까지 진행시키는 상태. v6 작업자는 첫 호출 하나로 항목 9개를 25분 넘게 제작. 정지 지점 자체가 부재.
지금은 호출 도중 판독이 기준에 닿는 즉시 그 호출을 차단.
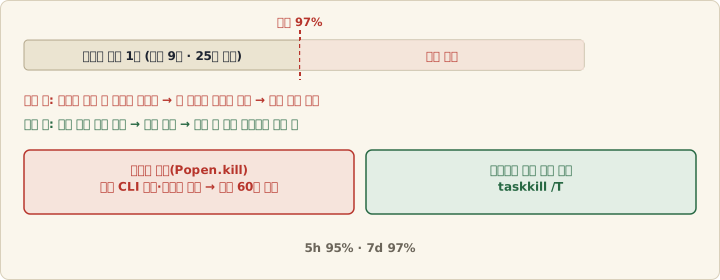
차단 방법에서 함정이 하나 더. Python의 Popen.kill()은 해당 프로세스만 종료하고, 그 아래에서 돌던 CLI 자식 프로세스는 생존. 살아남은 자식이 출력 파이프를 점유해 정지 자체가 60초 지연. Windows에서는 taskkill /T로 프로세스 트리 전체를 차단하도록 변경, 무응답·총 시간 상한으로 끊을 때도 같은 경로 사용.
| 항목 | 처리 |
|---|---|
| 끊긴 호출의 기록 | 호출 수, 비용 미상, 원본 응답, 이벤트에 그대로 보존 |
| 세션 | 유지. 재개 시 「도중에 끊김」 안내와 함께 같은 세션으로 이어 감 |
| 5시간 창 | 리셋 후 자동 재개 대기 |
| 주간 창 | 사람 도움 요청 후 재개 |
회귀 테스트의 출발점은 실제 정지 실패 상황의 재현, 고치기 전 코드에서 실패하는지부터 확인. 전체 테스트 248개 통과, 차단 함수를 예전 방식으로 되돌리거나 끊긴 호출 기록을 지우는 변이 2개도 테스트가 검출.
남은 과제
| 한계 | 상태 |
|---|---|
| 트리 밖으로 빠져나간 손자 프로세스 | taskkill /T로는 차단 불가. Windows Job Object가 근본책이지만 기록만 보관 |
| 도구 실행 도중 강제로 끊은 세션의 재개 | 실전에서 호출 도중 끊긴 세션을 같은 세션으로 이어 간 사례 2회. 끊긴 시점이 도구 실행 중이었는지는 미검증 |
| PC 절전 | 절전 중에는 리셋 후 자동 재개 미작동, 깨어난 뒤에도 남은 기록 0. 원인 조사 미완료 |
가장 큰 구멍은 마지막 항목. 무인 엔진의 전제는 사람이 없어도 작업이 이어지는 것인데, 기계가 잠들면 이어 갈 주체 자체가 부재. 그래서 당분간은 엔진 실행 중 PC 절전 금지로 운영.
정리
- 관측 장치는 AI 호출 금지. 기록을 읽기만 하면 비용 0.
- 대시보드는 보안 알림을 예외로 끄지 않고 화면을 PC 밖으로 옮겨 해결. 웹 QA의 헤드리스 브라우저에는 같은 알림이 남아 있어 미해결.
- 진행률은 「고정값」이 아니라 실제 변화량 기준. 고정값으로는 작업 중과 정지 상태의 구분 불가.
- 정지 조건은 가장 긴 호출 하나를 기준으로 설계. 「다음 호출 전」은 호출이 길어지면 무의미.
- 프로세스 차단 시 자식까지 종료됐는지 실측. 부모 종료와 정지 완료는 별개.
English version
The previous post covered the work engine’s design. This one is about the two things I bolted on once it was actually running unattended: a way to see what it’s doing while nobody is at the desk, and a way to make sure it stops when it has to.
Both were tested in real use. I watched the engine work through 15 consecutive jobs on another project on this screen, and it hit usage limits, stopped, and resumed several times along the way.
A dashboard that makes zero AI calls
The engine already logs a lot: which role was called on which model, which tools it used, which stage it’s in. The dashboard just reads those records and puts them on one screen.
| Principle | Why |
|---|---|
| Zero AI calls | If watching costs tokens, watching eats into the work |
| Read-only | The screen must have no way to change engine state |
| Engine only gains record fields | The dashboard must not change how the engine behaves |
On the engine side the only change was a few more record fields (events, a heartbeat, current state). A tool call took 0.1–1.7 s to go from the engine’s log to the dashboard server (8 samples); the screen refreshes every 2 s.
One snag along the way: I first put the dashboard on port 8765, which the engine’s own web-QA test server already used. With the dashboard running, the full test suite opened the dashboard instead of its own page and failed. It moved to 8799, and the suite is now run with the dashboard up to prove they coexist.
A ransomware alert pushed it to the cloud
The first version was a dedicated browser window on the PC, launched with its own profile so a single shortcut would open it with no console. While it was open, Windows Security raised a Controlled Folder Access alert every 1–3 minutes — the ransomware protection feature. The event log confirmed it was the browser, launched with a fresh profile, being blocked by that feature.
I could have added an exclusion to silence it. Instead, with the goal of being able to check from anywhere, the screen moved off the PC.
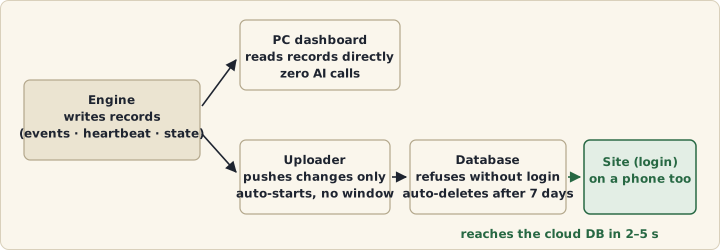
| Piece | What it does |
|---|---|
| Uploader | Starts with the engine’s run commands, no window; pushes only changed records; exits after 10 idle minutes |
| Database | Refuses tables and files without login; records older than 7 days are deleted automatically |
| Site | Login only; same screen code as the PC version; no overflow at phone width (390 px) |
The first sync pushed 7 days of history — 14 jobs, 491 files, 28.3 MB — in 96 s. After that only changes go up, and a no-change sync takes 0.2 s. On a practice job, call starts reached the cloud database within 2 s, tool use within 2–5 s, and stage changes within 3–5 s. Account usage updated mid-call too.
Two ways the screen lied
In use, the screen showed the wrong thing twice.
A screen left open kept showing an old job. The dashboard picked which job to show only when first opened. If a new job started while it was open, the screen stayed on the old one. It now always follows whatever is running: a new job takes over the screen within about 6 s, two projects running at once get a switch button, and the list of past jobs is collapsed.
Progress sat at 5% for 25 minutes. Progress was a fixed value per stage, so while the builder spent 25-plus minutes on its first call, the screen said 5% the whole time. You couldn’t tell working from stuck. It now fills in progress within each stage:
| Stage | Progress within the stage |
|---|---|
| Build | Share of this job’s target files modified since the build started |
| Scenario run | Share of scenarios finished |
| Evaluation call | Elapsed time ÷ usual duration (marked as an estimate) |
Progress stops just short of the next stage’s value, and if a stall is suspected it falls back to the stage value alone. Because the engine imports the dashboard code at startup, the change was built in a copy and swapped in file by file atomically so a running engine wouldn’t break. Computed over the records of 43 real jobs, it produced zero errors.
Stopping: cutting a call mid-flight at the usage limit
Stopping matters more than watching. The engine reads the subscription account’s usage and stops at a threshold: 95% of the 5-hour window, 97% of the weekly window.
In real use it sat at 98% weekly and didn’t stop. The engine did read usage mid-call, but on crossing the threshold it only marked “stop before the next call” and let the current call run to completion. A v6 builder’s first call builds nine items over more than 25 minutes. The stopping point never came.
Now, the moment a mid-call reading reaches the threshold, that call is cut.
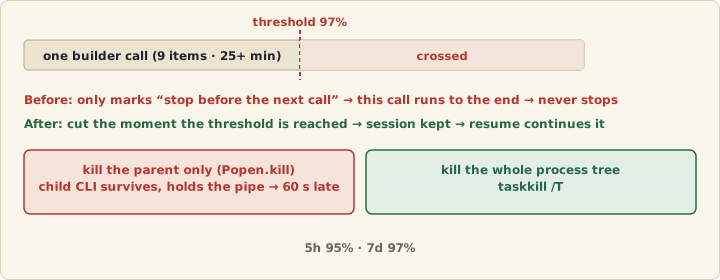
How to cut turned up another trap. Python’s Popen.kill() kills that process and nothing below it; the CLI child process it spawned survives. The survivor held the output pipe, and the stop itself was delayed by 60 seconds. On Windows it now uses taskkill /T to take down the whole tree, and the idle and total-time cutoffs go through the same path.
| Item | Handling |
|---|---|
| Records of a cut call | Kept: call count, cost unknown, raw response, events |
| Session | Kept; on resume it continues the same session with a note that it was cut |
| 5-hour window | Waits for the reset, then resumes automatically |
| Weekly window | Asks a human for help, then resumes |
The regression tests start by reproducing the exact run that failed to stop, confirmed failing on the old code first. All 248 tests pass, and the suite catches both mutants: reverting the kill to the old method, and dropping the record of a cut call.
What’s still open
| Limit | Status |
|---|---|
| Grandchild processes that escaped the tree | taskkill /T can’t reach them. A Windows Job Object is the real fix; logged, not done |
| Resuming a session cut in the middle of a tool call | Twice in real runs, a session cut mid-call resumed as the same session. Whether either cut landed during tool execution is unverified |
| PC sleep | While the PC sleeps, the post-reset auto-resume can’t run, and nothing was logged after it woke. Investigation isn’t finished |
The last one is the biggest hole. An unattended engine assumes work continues with nobody around — but if the machine sleeps, there’s nothing left to continue it. For now the rule is simply not to let the PC sleep while the engine runs.
Summary
- A watcher shouldn’t call the AI. Reading records costs nothing.
- The dashboard got rid of the security alert by moving off the PC, not by adding an exception. The headless browser used for web QA still triggers it.
- Progress should count what actually changed. A fixed value can’t tell working from stuck.
- Design the stop condition around the longest single call. “Before the next call” stops meaning anything once calls get long.
- When you kill a process, measure whether the children died too. A dead parent doesn’t mean you’ve stopped.